measuring waves in the currency market

K

kyle

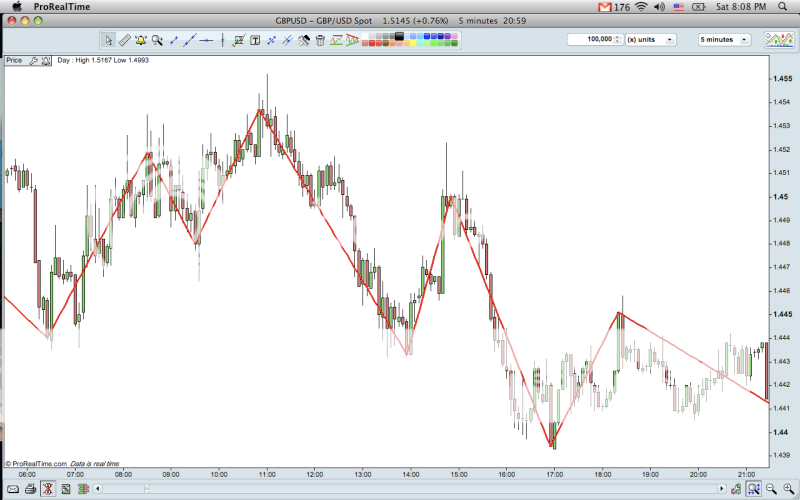
i'm trying to come up with a formula that will calculate the distance
between the peaks and troths in the fluctuations of these currency prices.
i've only been studying vba programming for a week so i don't have the
know-how to write the algorithm but here is how i imagine it would be done.

each wave must be at least 33 pips (a pip is one hundredth of a cent) long.
so the wave must extend longer than 33 pips either up or down and a peak or
troth is not recorded until the price swings in the opposite direction more
than 33 pips. once the last peak and the last troth is known, i want to
subtract the two from each other to come up with the length of the wave, as
well as the distance it took for the wave to form.

let me explain a little bit about my data. each row has four numbers, it
represents the opening price, the high price, the low price and the closing
price of a five minute block. only the high and low price i think is
important for this algorithm.

here's how i'm thinking the algorithm would work but i'm not familiar enough
with vba syntax to write it.

starting point = sp
active row high = arh
active row low = arl

if arh - sp > 33 then ar = peak
or if arl - sp < -33 then ar = troth

if arh > peak then arh = newpeak

if arl - newpeak < -33 then newpeak = ultimatepeak, subtract ultimatepeak
from sp, place value in row where ultimatepeak occurred, also subtract number
of blocks between ultimatepeak and starting point, place value in column to
the right.

if arl < troth then arl = newtroth

if arh - newroth > 33 then newtroth = ultimatetroth, subtract ultimatetroth
from ultimatepeak, place value where ultimatetroth occurred, also subtract
number of blocks between ultimatetroth and ultimatepeak, place value in
column to the right.


if arh > peak then arh = newpeak

if arl - newpeak < -33 then newpeak = ultimatepeak, subtract ultimatepeak
from ultimatetroth, place value where ultimatepeak occurred, also subtract
number of blocks between ultimatepeak and ultimatetroth, place value in
column to the right.


i have provided an example which you can see here:

http://spreadsheets.google.com/pub?key=t-3tRWLPRL-K3gN_AipJt3A&output=html

the first troth occurs at row 57 at the low price of 1.3985. this is
because the starting point is 1.4099 and the price never climbs above the
required 33 pips which would be 1.4132 in order for a peak to be registered,
but the price does climb below the required 1.4067 in order for a troth to be
registered. as the price falls below 1.4067 the first time (i think because
i was using a different program that could not register highs and lows only
closes) the active cell high is greater than the ultimate troth by 33 pips is
at row 57 1.3985. from 1.3985 the price then climbs upwards to 1.4210 at
row 102, during that time, the price never fell below the ultimate peak by 33
pips (i think, i might be wrong). we then subtract 1.4210 from 1.3985 and
put 225 in the h column (that's the length) and subtract 102 from 57 and get
45, that's the time and put that in column i. however we could not know that
1.4210 would be the ultimate peak until the active row low fell below 1.4177,
when that happened that's when we do the calculation. as the price falls
below 1.4177, each new low becomes the ulitmate low until the active row high
subtracted from that ultimate troth is greater than 33 pips. that happened at
row 130, price 1.4081. 1.4081 becomes the ultimate troth as soon as the
active row high rises above 33 pips which would be 1.4114. as soon as that
happens we subtract 1.4210 from 1.4081 and get -129 and put that in column H.
we also subtract 130 from 102 and get 28, that's the time and we put that in
column i. the price then rises to 1.4175 and once it falls more than 33 pips
from that peak below 1.4142 that's where the data ends for this example.

let me also explain why this is important. the market moves in waves.
certain wave patterns predict different lengths in future waves. by
understanding wave patterns one can have a better sense of where the market
is going.
 
M

marcus

Hi Kyle

Woah – long post. You will find the longer your posts in this forum
the less chance you have of getting traction but I understand after
looking at your problem why you went into so much depth.

Few things, the first ‘Troph’ occurs in Row 47. This is when the pips
fall below -33 for the first time.
Moreover you say:
"if arl - newpeak < -33 then newpeak = ultimatepeak"

What happens if there has not been a NewPeak when the pips fall below
-33. I have assumed you want to detract the ARL from the SP. This
would make sense as the SP will be the highest peak to this point.
The inverse is also true for the NewTroph, you need a scenario to
handle this.

Below is my stab at your problem. It assumes your data is in the
format presented on the google spreadsheet page. Check the variables
for column numbers to make sure yours line up with mine. For example
check that ARH is actually in column 4.

It keeps are running check on the highs and lows makes note of the
cells which are 33 pips higher or lower and ignores all the other
cells which fall within these ranges. Two UDFs calculate the peaks
and trophs for you. When there is a new high or low a calc is
performed to produce a variance from the peaks and trophs.

The results appear in Col I and J so if you have addition data in here
- lookout! This will be overwritten.

I have not addressed the time issue in the code. I have an example
spreadsheet which I can send you if you like. Bear in mind it is
almost 1am here in Oz so if you have questions I will be in la la land
for about 8 hours. This being said there are far more talented souls
in this forum, so you will have good company.

Take care

Marcus

Option Explicit

Sub HighLow()

Dim Res As Long
Dim InRow As Long
Dim ws As Worksheet
Dim EndRow As Long
Dim ARH As Long
Dim ARL As Long
Dim i As Long
Dim sp As Double
Dim Peak As Double
Dim Troph As Double
Dim NewPeak As Double
Dim NewTroph As Double

Set ws = ActiveSheet
EndRow = Range("A65536").End(xlUp).Row
InRow = 2 'First Row of data
ARH = 4
ARL = 5
Res = 9 'Result column

With ws
sp = .Cells(2, 3).Value
For i = InRow To EndRow
Peak = .Cells(i, ARH) - sp
Troph = .Cells(i, ARL) - sp
'Peak Part
If Peak > 0.0033 Then
.Cells(i, Res) = "Peak"
NewPeak = MyMax(Range(Cells(InRow, ARH), Cells(i, ARH)))
If .Cells(i, ARH) >= NewPeak Then
.Cells(i, Res) = "NewPeak"
If NewPeak - NewTroph > 1 Then 'Handle 0 for NewTroph
.Cells(i, Res + 1) = NewPeak - sp
Else
.Cells(i, Res + 1) = NewPeak - NewTroph
End If
End If
'Troph Part
ElseIf Troph < -0.0033 Then
.Cells(i, Res) = "Troph"
NewTroph = MyMin(Range(Cells(InRow, ARL), Cells(i, ARL)))
If .Cells(i, ARL) <= NewTroph Then
.Cells(i, Res) = "NewTroph"
If NewTroph - NewPeak > 1 Then 'Handle 0 for NewPeak
.Cells(i, Res + 1) = NewTroph - sp
Else
.Cells(i, Res + 1) = NewTroph - NewPeak
End If
End If
Else 'Handle neither
.Cells(i, Res) = ""
End If
Next i
End With
End Sub

Function MyMax(MyRng As Range)
MyMax = WorksheetFunction.Max(MyRng)
End Function

Function MyMin(MyRng As Range)
MyMin = WorksheetFunction.Min(MyRng)
End Function
 
K

kyle

Marcus,

thank you so much for agreeing to help me out. i can't thank you enough.
your answer is excellent. however there are still a few problems. i've
posted another spreadsheets with the results. the code did not register all
of the waves. i don't know why. i've also uploaded a visual chart of what
the waves look like, hopefully that might help you visualize it better.
again, i can't thank you enough for agreeing to help me.

also would it be possible to delete the info after the ultimate peak/trough
is established? i have to have those deleted eventually so that i can do a
statistical analysis of the lengths of the waves.


http://spreadsheets.google.com/ccc?key=0AtzzW6-3m2qGdE8xbUZYdURZNU1Xemk3MXlJZ0MtMGc&hl=en

Picture8-3.png


in this visual the software is only able to measure waves by the price's
close of a five minute bar, not it's high and low.
 
M

marcus

Hi Kyle

Thanks for the reply. The way I have set this up is if the Peak is
greater than 33 points from the starting point SP, then do something.
In the examples you have highlighted the pips are not in this 33 point
zone so nothing is done. Row 78 has a 27 point spread so nodda
happens.

Sounds like what you want is every time there is a newtroph this
becomes the new SP. Then when the spread is greater than 33 points
from NewPeak to newSP then do something.

Is this correct?

Take care

Marcus
 
K

kyle

hi Marcus,

i think i came up with a better way to think of the algroithm

if active row high greater than old high then active row becomes new high
or if ((new high - active row low) < -.0033) then subtract newhigh from the
trough before it.

after that

if active row low lesser than newtrough then active row becomes newlow
or if ((activerowhigh - newlow) > .0033) then subtract newlow from the
newhigh before it.

i hope that helps. just remember we can never know the peak or trough of a
wave until the price travels higher or lower than 33 pips.
 
K

kyle

here's something else. with each new row we are making two tests if we are
going up we are testing, one, to see if there is a new high, and two, to see
if the new low is lesser than 33 pips subtracted from the ultimate high.
 
M

marcus

Hi Kyle

Hopefully we are getting closer. This part

"if active row high greater than old high then active row becomes new
high "

has always been true the model does this.

The second part now

or if ((new high - active row low) < -.0033) then subtract newhigh
from the
trough before it.

Do you mean subtract the newhigh from the newtrough. This will cause
odd results so I put

The Active Row high less the NewTrough.

This is the line you will want to play with

CatchP = .Cells(i, ARH) - NewTrough
CatchT = .Cells(i, ARL) - NewPeak

These two lines control the second part of the equation. Let me know
what these should be if this version of the algorithm is not getting
the job done. If you change this to

CatchP = NewPeak - NewTrough
CatchT =NewTrough - NewPeak

You will see the results look very wrong. Let me know how this next
stab goes.

Take care

Marcus


Full code below.

Option Explicit

Sub HighLow()

Dim Res As Long
Dim InRow As Long
Dim ws As Worksheet
Dim EndRow As Long
Dim ARH As Long
Dim ARL As Long
Dim i As Long
Dim sp As Double
Dim Peak As Double
Dim Trough As Double
Dim NewPeak As Double
Dim NewTrough As Double
Dim CatchP As Double
Dim CatchT As Double

Set ws = ActiveSheet
EndRow = Range("A65536").End(xlUp).Row
InRow = 2 'First Row of data
ARH = 4
ARL = 5
Res = 9 'Result column

With ws
sp = .Cells(2, 3).Value
For i = InRow To EndRow
'if ((new high - active row low) < -.0033) then subtract newhigh
from the trough before it.

Peak = .Cells(i, ARH) - sp
Trough = .Cells(i, ARL) - sp
CatchP = .Cells(i, ARH) - NewTrough
CatchT = .Cells(i, ARL) - NewPeak
'Peak Part
If Peak > 0.0033 Or CatchP > 0.0033 And CatchP < 1 Then
.Cells(i, Res) = "Peak"
NewPeak = MyMax(Range(Cells(InRow, ARH), Cells(i, ARH)))
If .Cells(i, ARH) >= NewPeak Then
.Cells(i, Res) = "NewPeak"
If NewPeak - NewTrough > 1 Then 'Handle 0 for NewTrough
.Cells(i, Res + 1) = NewPeak - sp
Else
.Cells(i, Res + 1) = NewPeak - NewTrough
End If
End If
' Trough Part
ElseIf Trough < -0.0033 Or CatchT < -0.0033 And CatchT < 1 Then
.Cells(i, Res) = "Trough"
NewTrough = MyMin(Range(Cells(InRow, ARL), Cells(i, ARL)))
If .Cells(i, ARL) <= NewTrough Then
.Cells(i, Res) = "NewTrough"
If NewTrough - NewPeak > 1 Then 'Handle 0 for NewPeak
.Cells(i, Res + 1) = NewTrough - sp
Else
.Cells(i, Res + 1) = NewTrough - NewPeak
End If
' sp = NewTrough
End If
Else 'Handle neither
.Cells(i, Res) = ""
End If
Next i
End With
End Sub
Function MyMax(MyRng As Range)
MyMax = WorksheetFunction.Max(MyRng)
End Function

Function MyMin(MyRng As Range)
MyMin = WorksheetFunction.Min(MyRng)
End Function
 
K

kyle

marcus,

thanks again for trying to help me out. we're still not there yet but
thanks again for working with me. first, i'm sorry but i'm using a different
set of data now. so i hope that doesn't confuse things.

in the following spreadsheet, the starting point should be the open at row
2, 1.4504, but that really doesn't matter because once we get the ultimate
trough, or peak things will be the same.

here is the data that i'm using. in it i have highlighted in yellow the
peaks and the troughs. in red i have highlighted the point at which we
subtract the peak from the former trough or vice versa.

http://spreadsheets.google.com/ccc?key=0AtzzW6-3m2qGdDF3eHhyOVNFUTJsa05Wc3JxUVdTdWc&hl=en

in this spreadsheet i have listen the peaks and troughs and at what row they
occurred. i also showed the results for your algorithm. your algorithm only
caught two troughs and one peak, whereas there should be 4 troughs and 3
peaks. i also have listed at what row do we then subtract the last peak or
trough from the peak or trough before it.

remember once the price travels 33 pips up from a trough or 33 pips down
from a peak that is the moment that we subtract the peak or trough from the
peak or trough before it.

http://spreadsheets.google.com/ccc?key=0AtzzW6-3m2qGdGNTTndKRzkyY1B6dGtuSVhwbjZwSXc&hl=en

for instance, at row 61 a trough is reached at price 1.4429, once the price
is greater than 1.4462 then we subtract that trough from the starting point.
that happens in row 62. then in row 78 a peak is reached at 1.4531, as soon
as the price slips below 1.4498 then we subtract that peak from the trough
before it. unfortunately that happens in that same cell. that might be a
problem. we do not know if the price first went to 1.4498 then shot up to
1.4531 or vice versa. i guess we'll just assume that the former happened,
but i realize that might make your algorithm harder to make.

i have a visual uploaded here:

http://i87.photobucket.com/albums/k137/kylefoley76/Picture8-3.png
 
M

marcus

Hi Kyle

That first link I can not access. Get into the other two OK. Can you
repost the first link.

OK what I have written will pick up the highest and lowest prices from
the list to the AHH/ARL point. There will never be an instance where
this does not occur.

This is what is confusing me. Some of the items you have picked up as
NewPeak are not peaks at all. Here is an example Row 153 you are
saying is a NewPeak. The price is 1.4518 this is ranked 28th at this
point. The code will never identify this as a peak, it has to be the
highest number in the list to this point to wear the NewPeak title.
Otherwise it is bog standard.

I will have a read of your above example and see if the penny drops.

Take care

Marcus
 
K

kyle

This is what is confusing me. Some of the items you have picked up as
NewPeak are not peaks at all. Here is an example Row 153 you are
saying is a NewPeak. The price is 1.4518 this is ranked 28th at this
point. The code will never identify this as a peak, it has to be the
highest number in the list to this point to wear the NewPeak title.
Otherwise it is bog standard.

now i see what the problem is. once again thank you for helping me out. if
you look at the following chart.

http://i87.photobucket.com/albums/k137/kylefoley76/Picture1-9.png

i'm measuring each wave, i'm measuring the distance between all four peaks
and troughs. the fact that peak 3 is less than peak 3 doesn't matter, it is
still a peak that needs to be measured. and it is a peak because the
distance between peak 3 and trough 3 is greater than 33 pips and the distance
between peak 3 and trough 4 is also 33 pips.

the spread sheet should be accessible now.

remember i'm eventually going to have about 500,000 rows of data so i'm not
simply interested in the highest out of 500,000. i'm looking to measure
about 5000 waves and then collect probability on those waves being a certain
length.
 
M

marcus

Hi Kyle

I will have another stab at this with your latest comments in mind. I
may have to rethink the process but I understand what needs to be
done. Thanks for getting the spreadsheet viewable it will help.

Take care

Marcus
 
M

marcus

Hi Kyle

I am sorry for the delay getting back to you. It is no longer the
weekend and we have the auditors (ehem proctologists) in here at work
and time has been at a premium.

OK there are some discrepancies between what you have as Peaks./
Troughs which are addressed below.

You say row 61 is the first trough but Row 51 has a variance of
-0.0067 between the SP and the ARL. This is the first time the
variance breaks -.0033 so this is where the process starts. With this
in mind row 53 and 54 are both Troughs with -0.0071 and -0.0072
variance from the SP. There is not a Peak per se till row 73 where
the Peak – Trough is 0.0098.

There is a trough on Row 78 as you suggested there was. Only one more
mention but I could go on. Why is Row 180 a Trough when the ARL of
row 179 contains exactly the same number as Row 180?

I could not see the references with Red and Yellow cells you
mentioned. Must have got lost in the WWW.


The following is a rework and starts with a bit of a fudge. VBA gets
told that the Peak is the Opening High and the Trough is the Opening
Low.

The code then runs a merry course till Row 51 where the first instance
of above or below .0033 RELATIVE TO THE SP is reached. Then the real
process starts.

This seems to capture the highs and lows but they do not match your
version of events. Have a look at it and get back to me. I have put
data in Cols 7,8, and 9 to assist in showing what is going on in the
back ground. Have a look at this variance column (Col 9) to see what
I am talking about.


Take care

Marcus

Option Explicit

Sub AnewProcess1()

Dim InRow As Long
Dim ws As Worksheet
Dim EndRow As Long
Dim ARH As Long
Dim ARL As Long
Dim i As Long
Dim j As Long
Dim sp As Double
Dim Peak As Double
Dim Trough As Double
Set ws = ActiveSheet
EndRow = Range("A65536").End(xlUp).Row
InRow = 2 'First Row of data
ARH = 4
ARL = 5
i = 2
With ws
sp = .Cells(2, 3).Value
Peak = .Cells(2, 4).Value
Trough = .Cells(2, 5).Value

Do
i = i + 1
Loop Until .Cells(i, ARL) - sp <= -0.0033 Or .Cells(i, ARH) -
sp >= 0.0033
'Catch the Peak or Trough before moving forward
For i = i To i
If .Cells(i, ARH) - sp >= 0.0033 Then
Peak = .Cells(i, ARH)

ElseIf .Cells(i, ARL) - sp <= -0.0033 Then
Trough = .Cells(i, ARL)
End If
Next

For j = i To EndRow

If .Cells(j, ARH) > Peak Then
Peak = .Cells(j, ARH)
.Cells(j, 7) = "Peak"
.Cells(j, 8) = Peak - Trough
End If

If .Cells(j, ARL) < Trough Then
Trough = .Cells(j, ARL)
.Cells(j, 7) = "Trough"
.Cells(j, 8) = Trough - Peak

End If

If Peak - Trough >= 0.0033 Then
.Cells(j, 9) = Peak - Trough
End If

If Trough - Peak <= -0.0033 Then
.Cells(j, 9) = Trough - Peak
End If

Next

End With
End Sub
 

Ask a Question

Want to reply to this thread or ask your own question?

You'll need to choose a username for the site, which only take a couple of moments. After that, you can post your question and our members will help you out.

Ask a Question

Top